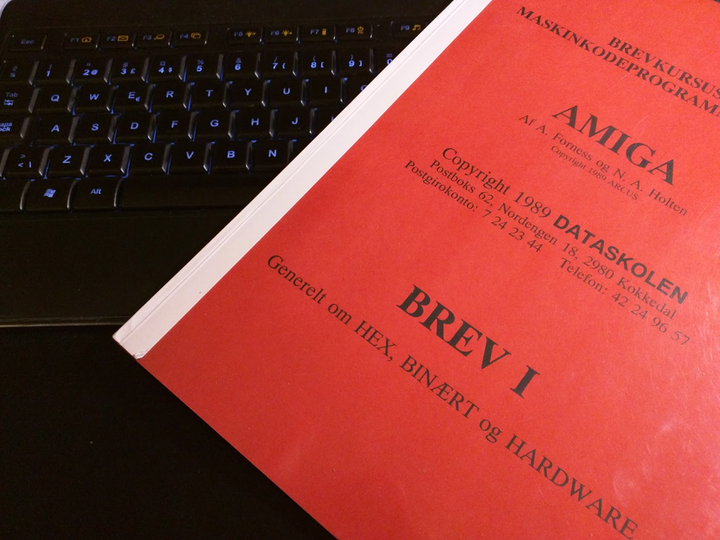
Amiga Machine Code Letter I - Debugger
 Amiga machine code - letter 1
Before we continue to letter 2 of the Amiga machine code course, I want to show the debugger in WinUAE. It’s a real gem and it makes your life as a programmer a whole lot easier.
Back in the day, I had an Action Replay card, which could do much of the same stuff as the WinUAE debugger. I used the Action Replay to parse endless lines of hex dumps, so that I could add lifes or power boosters in games. Who says you can’t learn anything from games 😎.
Let’s start the workbench and use the debugger on the little test program from letter 1, called mc0101. Here’s the machine code, listed together with the hex values in memory. How I did this is described here.
; file mc0101.S
move.w    #$4000, $DFF09A   ; 33 FC - 40 00 - 00 DF F0 9A
move.w    #$03A0, $DFF096   ; 33 FC - 03 A0 - 0D FF 00 96
loop:
move.w    $DFF006, $DFF180  ; 33 F9 - 00 DF F0 06 - 00 DF F1 80
btst      #6, $BFE001       ; 08 39 - 00 06 - 00 BF E0 01
bne.s     loop              ; 66 EC
move.w    #$83A0, $DFF096   ; 33 FC - 83 A0 - 00 DF F0 96
move.w    #$C000, $DFF09A   ; 33 FC - C0 00 - 00 DF F0 9A
rts                         ; 4E 75
From the Workbench, open the CLI (Command Line Interface).

Wait before you start the mc0101 program. We first have to set a breakpoint in the debugger. You enter the WinUAE debugger by pressing shift-F12.

The last line in the debugger window is for entering debugger commands. I have drawn a green box around the area. There’s a list of debugger commands here. Now type the following:
fp "mc0101"
The debugger will now step forward until the process “mc0101” is active. Which means that we continue until our mc0101 program is run.
Go back to the Workbench and in the cli write mc0101. If your save disk is in e.g. df1, then write df1:mc0101. The Amiga will now start to execute the program as a process named “mc0101”, which will trigger the breakpoint in the debugger.
The debugger will now look like this:

In the top green box, we see our program in both hex and in assembly! The bottom green box shows the current, and next, position of the program counter.
Notice that our loop label is missing. The label has been replaced by an offset. The debugger is even so friendly as to print the resulting address of the program counter added with the offset.
0001DD9A 66ec BNE.B #$ec == $0001dd88 (T)
This means that if the previous bit test was not satisfied, the program will jump to $01dd88. This is the loop that performs the busy wait, until the user presses the left mouse button.
You can step through the program by using “t” in the debugger command line. To make the Amiga run again, just type “g”, also in the debugger command line.
Using the debugger to step through a program is a great way to learn about the Amiga. From the debugger we can see all kind of things, like the data- and address registers, the program counter, and follow loops in the program.
Previous post: Amiga Machine Code Letter I - Deep Dive
Next post: Amiga Machine Code Letter I - Hint.